R の組み込みデータセット: 一覧と便利な使い方
UB3/informatics/r/built_in_dataset
このページの最終更新日: 2026/07/11- R の組み込みデータセットとは
- chickwts
- iris
- mtcars
- lh
- orange
- swiss
- Toothgrowth
- BostonHousing
- CO2
- cars
- eurodist
- trees
広告
R 組み込みデータセットとは
data() でデフォルトの組み込みデータセット一覧が表示される。
また、R に新しい パッケージ をインストールすると、データセットも一緒にインストールされることがある。特定のパッケージに含まれる組み込みデータセットの一覧をみたいときは、data(package = "パッケージ名") とする。
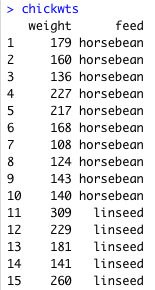
chickwts
horsebean, linseed, soybean, sunflower meatmeal, casein の 5 種類のエサを与えられて育ったニワトリの体重データ。棒グラフ や バイオリンプロット のページで使用している。以下のような形式で、ToothGrowth と似ている。
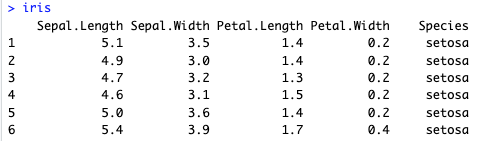
iris
iris は「アヤメ」の意味。花弁の長さ petal length、がくの長さ sepal length などのデータが入っているが、petal とか sepal とか length とか width とか非常にややこしく、しかも花のサイズとかあまり興味がないので、あまり使いたくないデータセットである。
iris は統計学者フィッシャーによるデータセットらしく、フィッシャーが優生学の信奉者だったこともあり、iris の使用停止を勧める こんなページ もあるようだ。
mtcars
32 obs of 11 variables のデータ。32 種類の車種について、11 の項目が並ぶ。使用しているページには、以下のようなものがある。
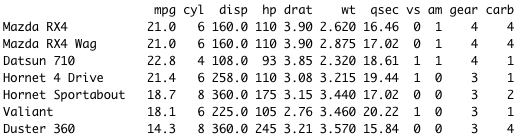
- 排気量 displacement、マイレージ/ガロン (燃費) mpg の数値が大きい。
- cyl と gear はシリンダーとギアの数で、整数値をもつ離散変数。
- vs と am は、エンジン (0 = V-shaped, 1 = straight) と Transmission (0 = automatic, 1 = manual) で、0 または 1 の二値変数である。
lh
血中ホルモン量のタイムコース、48 タイムポイント。typeof で double となるので、一次元の vector データだと思うのだが、is.vector では false になる。
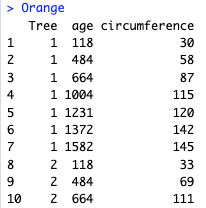
Orange
木の年齢と胴回りのデータセット。木は 1 から 5 という名前の 5 つのグループに分かれており、数字をカテゴリー変数をして扱うオプション as.factor を覚えるのにも良い。
他のデータセットともに、R ggplot: 複数のグラフをまとめて出力する で使用。
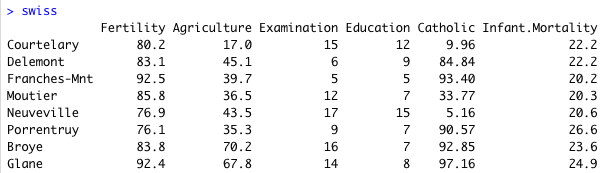
swiss
スイスの 47 の地区における出生率と、さまざまな社会的要因のデータ。
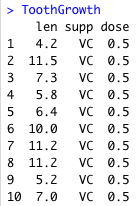
ToothGrowth
ビタミン C またはオレンジジュースをいくつかの dose で投与されたモルモットの歯の長さのデータ。chickwts と似ているが、dose の違いという要素がある。60 obs x 3 variables, つまり 60 行 3 列のデータ。
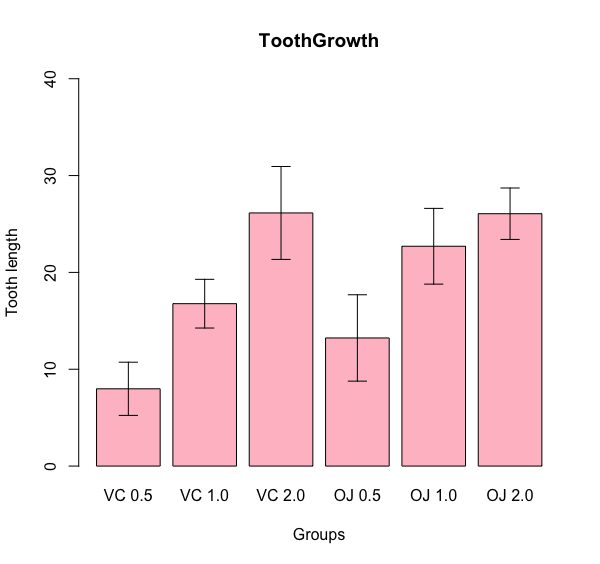
全体としては 二元配置分散分析 のデータ。平均値などの算出、棒グラフ、t 検定など、さまざまな関数の練習に有用。
データの形式、棒グラフはこんな感じ。
BostonHousing
ボストン地区の家の値段と、さまざまな要因のデータ。mlbench というパッケージに含まれるデータセットなので、まずはこのパッケージをインストールする必要がある。正則化回帰 で例として用いている。
CO2
植物の二酸化炭素取り込み量データ。
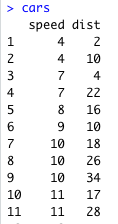
cars
speed, dist の 50 行 2 列データ。shapiro.test によると speed は正規分布に従うが dist は正規分布に従うとは言えない。wilcox.test で例として用いた。
広告
「あとがき」で当サイトを参考にしたと書いてくれているラノベです。Kindle Unlimited で読めました。ストーリーと文章が良く、面白かったです。
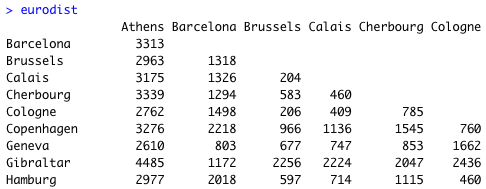
eurodist
ヨーロッパの様々な都市間の距離を集めたデータ。主座標分析 PCoA で使用。
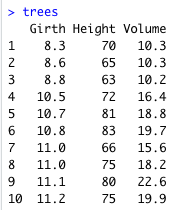
trees
31 本の木について、胴回り Girth、高さ Height、容積 Volume を調べたデータ。
広告
References
- 統計を学びたい人へ贈る、統計解析に使えるデータセットまとめ. Link: Last access 2022/07/09.
コメント欄
サーバー移転のため、コメント欄は一時閉鎖中です。サイドバーから「管理人への質問」へどうぞ。