Matlab: boxplot 関数
UB3/informatics/commands_matlab/boxplot_matlab
このページの最終更新日: 2026/04/09- boxplot 関数の使い方
- boxplot のオプション
広告
boxplot 関数の使い方
>> A=normrnd(2,1,10,1); %平均2、標準偏差1の正規分布に従う10行1列の行列
>> B=normrnd(1,1,10,1); %平均1、標準偏差1の正規分布に従う10行1列の行列
>> X=[A B]
X =
2.0662 1.0000
2.6524 0.9451
2.3271 1.9111
3.0826 1.5946
3.0061 1.3502
1.3491 2.2503
2.2571 1.9298
1.0556 1.2398
0.6782 0.3096
2.9248 0.3484
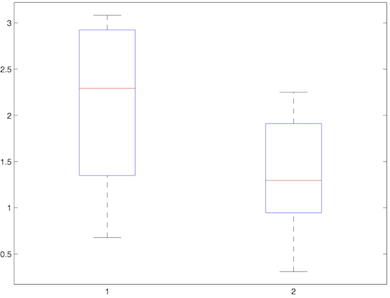
というデータがあるとき、
>> boxplot (X)
で図のような箱ひげ図ができる。
広告
「あとがき」で当サイトを参考にしたと書いてくれているラノベです。Kindle Unlimited で読めました。ストーリーと文章が良く、面白かったです。
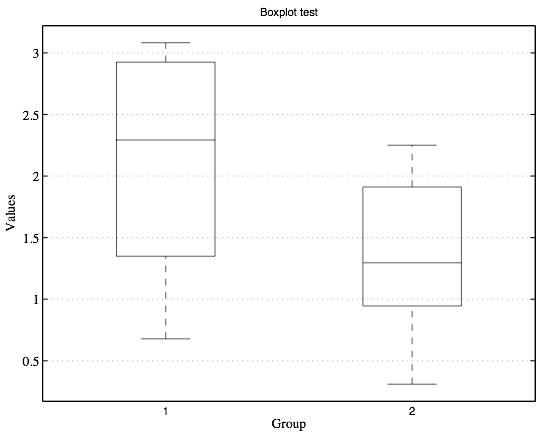
オプションの使い方
上記の boxplot を、オプションを使って変更することができる。以下は一例。
clear;clf;
load('X.mat');
boxplot(X,'boxstyle','outline','colors','k','notch','off','orientation','vertical',...
'width',0.4,'medianstyle','line');...
xlabel('Group','FontName','Times New Roman','Fontsize',12);
ylabel('Values','FontName','Times New Roman','Fontsize',12);
title('Boxplot test');set(gca,'LineWidth',1);...
set(gca,'FontSize',12,'FontName','Times New Roman');...
set(gca,'YAxisLocation','left');
daspect([1 2 1]); % You have to include z value. daspect([1 2]) results in error.
set(gcf,'color','white'); % Change background color from gray (default) to white.
grid on;
代表的なオプションには、以下のようなものがある。
plotstyle
- traditional (default); 普通の箱ひげ図。
- compact; 多くのグループをもつプロットに対して設計されるボックス スタイル。このスタイルを指定すると、次の表で説明するように、他のパラメーターの既定値が変更されます。
boxstyle
- outline (default); 塗りつぶさない広いボックスで、ひげを点線で描画する。
- filled; 塗りつぶされた狭いボックスで、ひげを実線で描画する。
symbol
- 外れ値 outlier に対して使用する記号と色を設定する。
- plot 関数 の LineSpec parameter と同じ値を使用する。たとえば、'r+' は赤の十字(default)、'ko' は黒の丸である。
- >> boxplot(X,'symbol','ko') のように指定する。
- 記号が省略された場合、外れ値は表示されない。
- 色が省略された場合、対応するボックスと同じ色になる。
>> set(gca,'XTickLabel',{' '}); でラベルを消すことができる(1)。
広告
References
コメント欄
サーバー移転のため、コメント欄は一時閉鎖中です。サイドバーから「管理人への質問」へどうぞ。